The Violin Keyboard
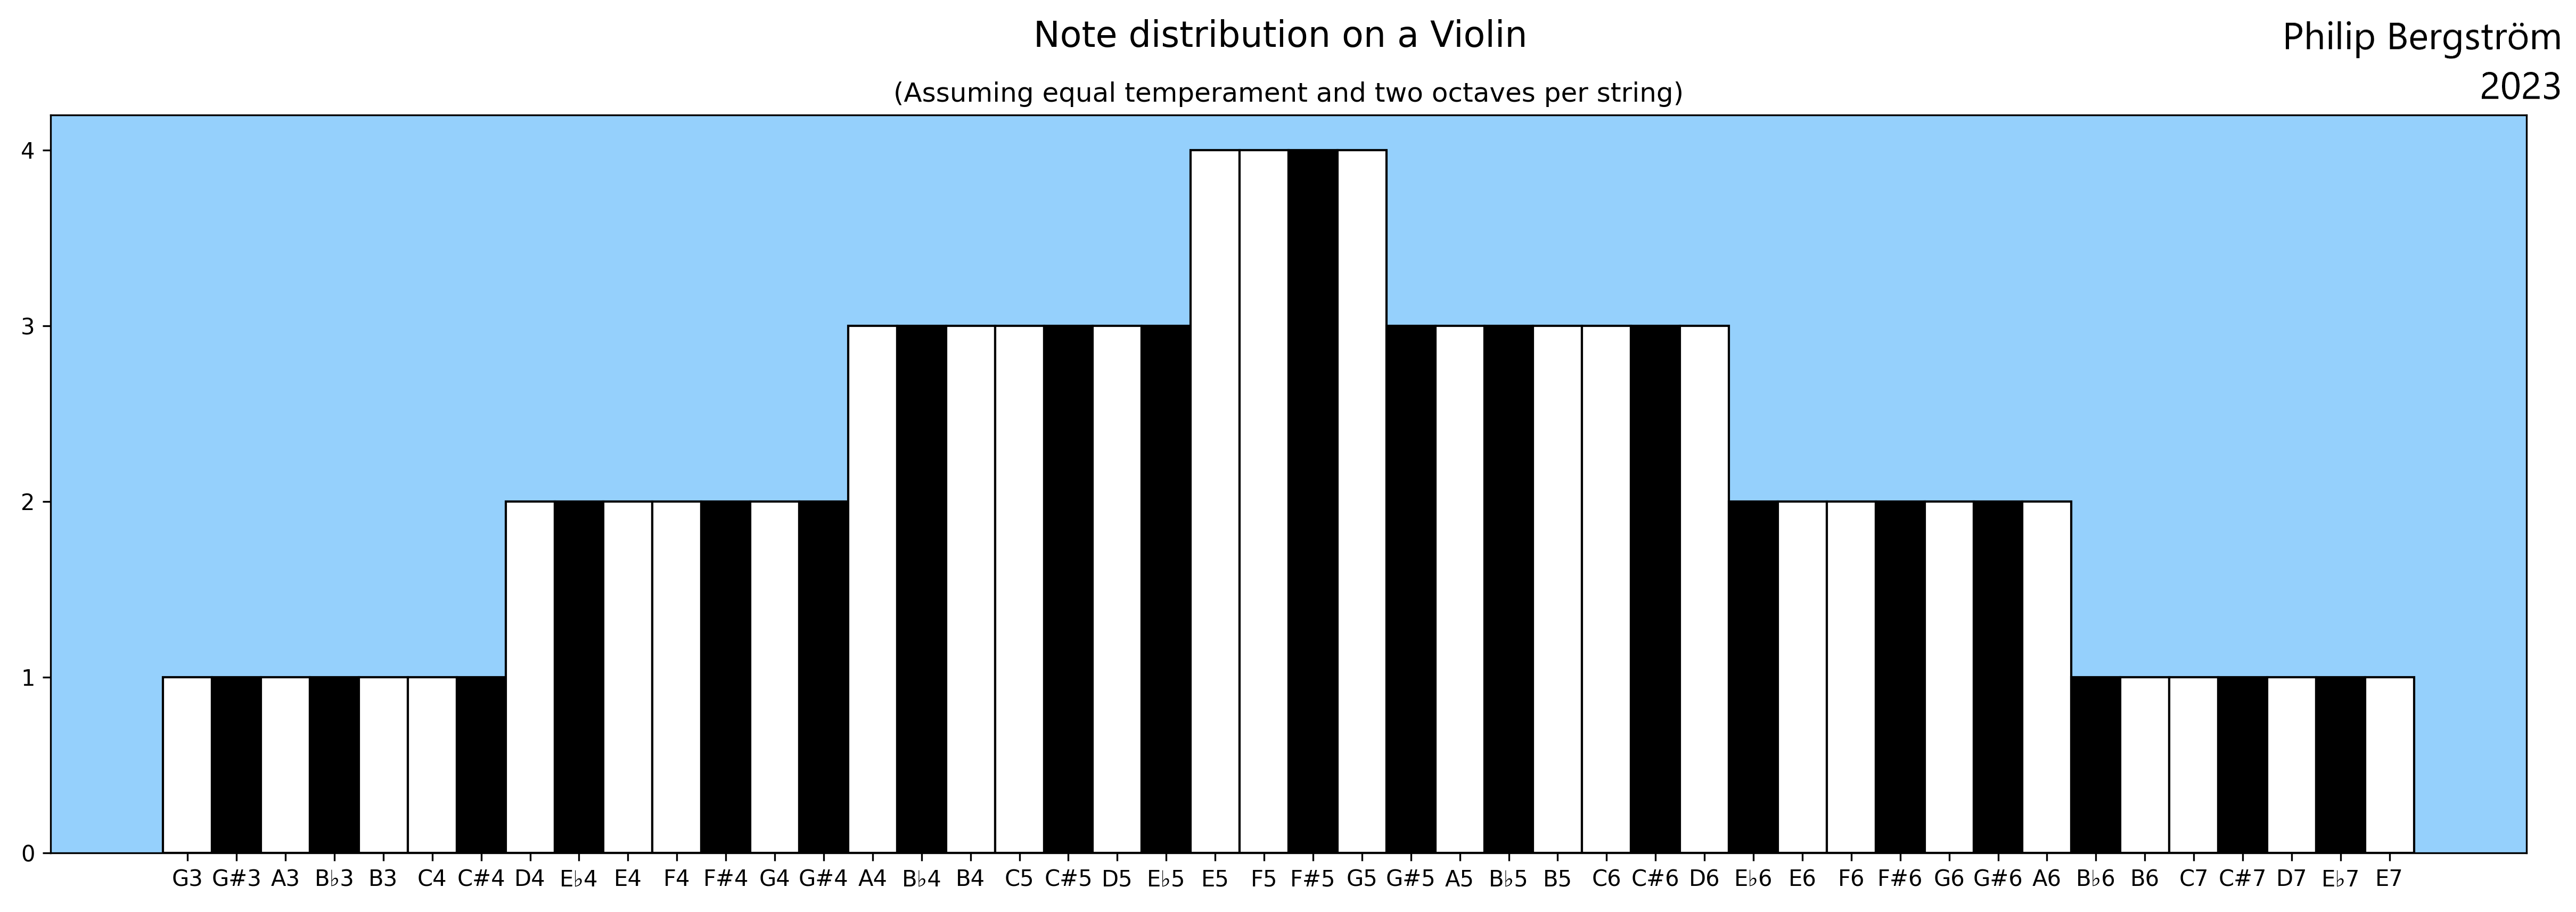
This is a bar plot of the distribution of notes on a violin, assuming equal temperament and a range of two octaves per string (e.g. G3-G5 on the G-string). The idea for the visualization was inspired by guitarist Milton Merkimides who made a similar illustration for the guitar.